As explained on the homepage of the website, the purpose of this project was to discern how certain decisions that were made by the United States Government affected the population's emotions. To accomplish this task we picked 10 important decisions that the government made and then using the dates that the decision occurred, pulled posts from the data that we scraped. VADER was used to calculate the sentiment of those posts and then the data was visualized to discover if the mean was negative, neutral, or positive. Then we ran a Kruskal-Wallis Test to see if there was any significant difference between the means of the decisions made. Lastly, a Dunn's Test was run to do a pairwise comparison to find out specifically which pairs of groups were statistically significantly different.
The following 10 decisions are listed in chronological order. More information on each decision can be found here.
There is no difference in the sentiment means of the decisions made by the United States Government during the Covid-19 pandemic.
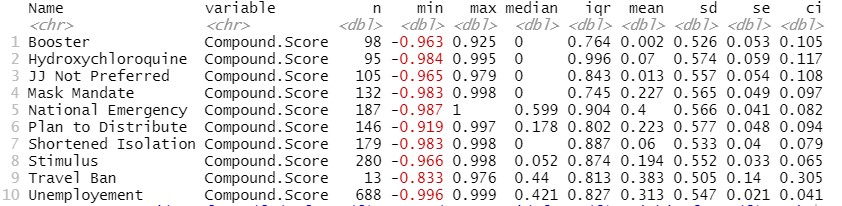
Below is the summary statistics of our data
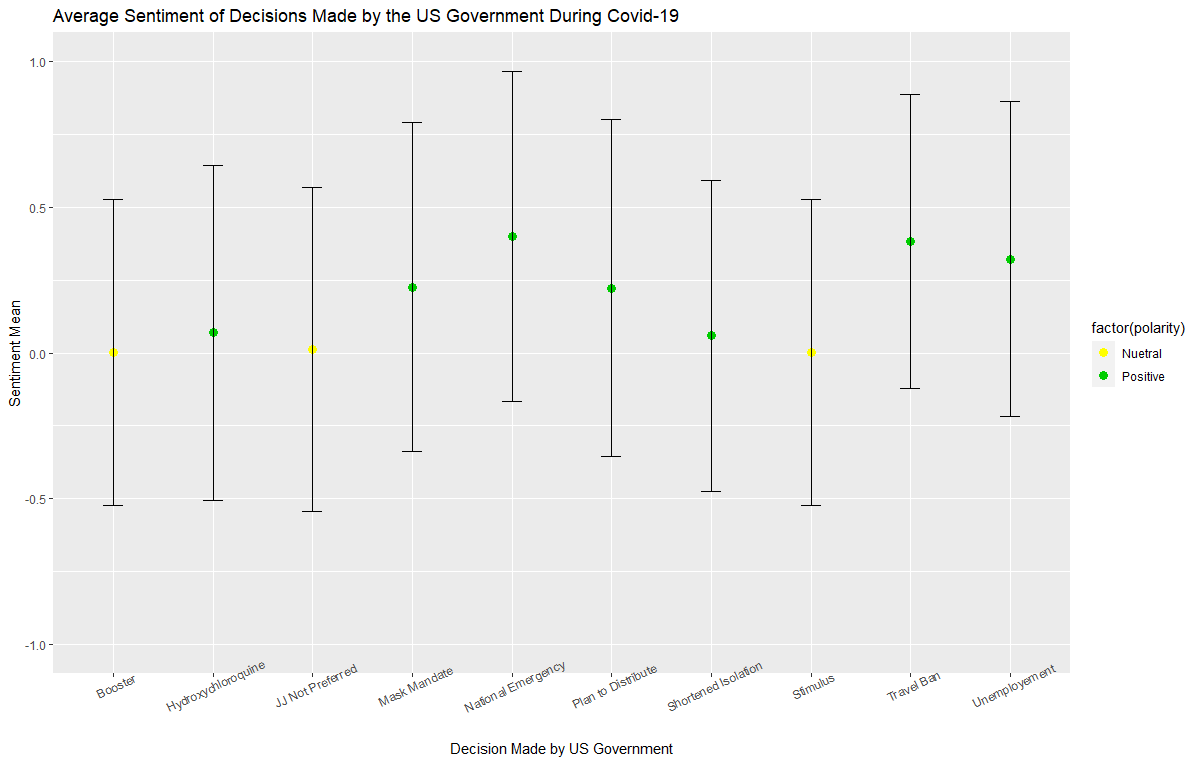
Below is a graph that displays the average sentiment, standard deviation, and polarity of each decision. A neutral polarity is decided by the score being between -0.05 and 0.05. Anything lower is considered negative, while everything above is positive. This is in conjunction with VADER, which was used to determine the sentiment of each post.
Below are the results from the Kruskal-Wallis test. This test was chosen because we have a continuous dependent variable in the compound scores, 10 total categorical groups of independent variables in the decisions, and independence of observations since we only allowed a single post from each respective user. Since our data contains different n values for each decision and is not normally distributed, we would need to perform this test instead of a one-way Anova. We received a p-value much smaller than 0.05 which means there was a statistically significant difference between the sentiment of each decision made. This allows us to reject the null hypothesis.

Below are the results from Dunn’s test. We used this post hoc test to pinpoint which specific means are significant from the others. Here we learned that there was a significant difference between the following decisions made: Booster and Hydroxychloroquine, Booster and National Emergency, Booster and Unemployment, Hydroxychloroquine and National Emergency, Hydroxychloroquine and Unemployment, JJ not Preferred And National Emergency, JJ not Preferred and Unemployment, National Emergency and Shortened Isolation, National Emergency and Stimulus, Shortened Isolation, and Unemployment.